
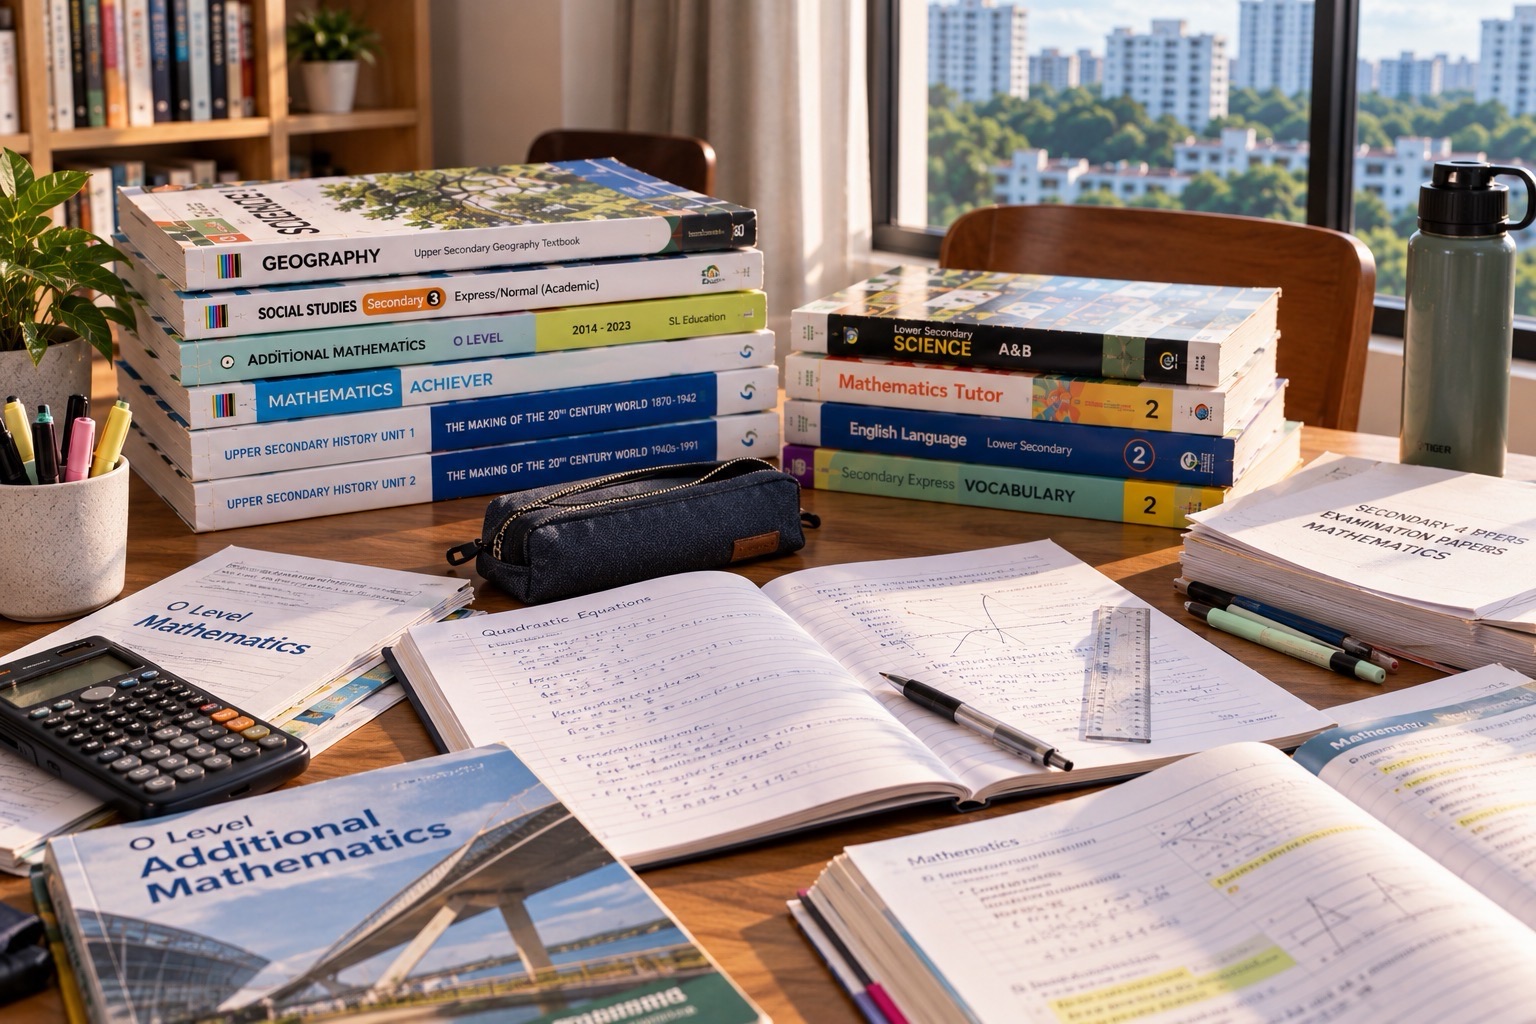
Singapore Math graphs and charts guide for families and teachers outside Singapore. What Primary 1 to Primary 4 students learn about picture graphs, bar graphs, tables, line graphs and pie charts, and how to practise reading them at home.
A graph is a picture of numbers.
Reading it well means knowing what each mark stands for.
In Singapore Mathematics, graphs and charts are taught in small steps from Primary 1 to Primary 4. Students begin with picture graphs, add scales, move to bar graphs, and then read tables, line graphs and pie charts.
There is no Statistics topic in Primary 5 Standard Mathematics. Average follows in Primary 6, and statistical diagrams return in Secondary 1.
This guide is useful for families and teachers who want to:
- understand what Singapore expects from Primary 1 to Primary 4;
- teach graph reading at home in a clear sequence;
- prepare a child who is moving into a Singapore school; or
- support a student using Singapore Math materials in another country.
Quick facts
Level: Primary 1 to Primary 4 (common to all students)
Strand: Statistics
Official source: MOE Primary Mathematics Syllabus, the 2021 syllabus first examined at PSLE in 2026
Comes after: Whole Numbers and Place Value and Multiplication Tables
Leads to: Average and Statistical Diagrams
What Graphs and Charts Mean in Singapore Mathematics
Every graph in the primary syllabus answers the same two questions: how many, and compared with what?
A picture graph uses symbols. A bar graph uses lengths. A table lists the numbers directly. A line graph shows how one quantity changes, often over time. A pie chart shows how a whole is split into parts.
In the 2021 syllabus, the Statistics strand at Primary 1 to 4 is about reading and interpreting these displays. At Primary 4, students also complete a table from data.
The skill is not drawing a pretty chart. It is reading the key or scale, finding the numbers, and answering questions about them.
That makes graph work a quiet test of place value, multiplication and fractions, all at once.
Where Graphs and Charts Sit in the Singapore Syllabus
The Primary 1 to 4 syllabus is common to all students. The Statistics content builds one level at a time:
- Primary 1: reading and interpreting picture graphs;
- Primary 2: picture graphs with scales;
- Primary 3: reading and interpreting bar graphs, including different scales on the axes; and
- Primary 4: completing a table from data, and reading and interpreting tables, line graphs and pie charts.
Primary 5 Standard Mathematics has no Statistics topic. At Primary 6 Standard, the Statistics content is average.
| Level | Statistics content |
|---|---|
| Primary 1 | Picture graphs |
| Primary 2 | Picture graphs with scales |
| Primary 3 | Bar graphs, with different scales on the axes |
| Primary 4 | Tables, line graphs and pie charts; completing a table |
| Primary 5 Standard | No Statistics topic |
| Primary 6 Standard | Average of a set of data |
Foundation Mathematics revisits this work. Its Primary 5 content includes tables, bar graphs and line graphs, and its Primary 6 content includes pie charts and average.
In Secondary 1, students meet tables, bar graphs, pictograms, line graphs and pie charts again, this time with their purposes, advantages and disadvantages.
How Singapore Teaches Graphs and Charts
1. Start with one symbol for one object
At Primary 1, each picture stands for one thing. Children count the pictures in each row and compare rows: which has more, which has fewer, and how many more.
2. Add a scale
At Primary 2, one symbol can stand for more than one object. The key might say that each symbol stands for 5 books. Counting becomes multiplication, which links to the tables of 2, 3, 4, 5 and 10 learnt in the same year.
3. Replace symbols with bars
At Primary 3, bars replace rows of pictures. The scale on the axis matters: one grid line may stand for 2, 10 or 50. Students learn to read the scale before reading the bar.
4. Read tables and complete them
At Primary 4, students read data arranged in rows and columns and fill in missing entries. A missing part or a missing total is found by adding or subtracting.
5. Read change on a line graph
A line graph joins points to show how something changes. Students read the value at each point and compare them, for example to find when a temperature rose the most.
6. Read parts of a whole on a pie chart
A pie chart shows how a whole is shared. Students say which part is largest and use simple fractions of the whole to find how many are in each part.
Each step adds one new idea to the last. Children who rush past the scale stage often misread bar graphs later.
Worked Examples
Reading a picture graph with a scale
Question: In a picture graph, each symbol stands for 4 stickers. Ali’s row has 7 symbols and Ben’s row has 5 symbols. How many more stickers does Ali have than Ben?
Step 1. Read the key: 1 symbol = 4 stickers.
Step 2. Ali has 7 − 5 = 2 more symbols than Ben.
Step 3. 2 symbols = 2 × 4 = 8 stickers.
Check: Ali has 7 × 4 = 28 stickers and Ben has 5 × 4 = 20 stickers, and 28 − 20 = 8.
A common wrong answer is 2. That counts symbols, not stickers.
Reading a pie chart
Question: A pie chart shows the favourite fruits of 40 pupils. Half chose apples and a quarter chose bananas. The rest are shared equally between oranges and grapes. How many pupils chose grapes?
Step 1. Apples and bananas together are 1/2 + 1/4 = 3/4 of the pupils.
Step 2. The rest is 1/4 of the pupils, and 1/4 of 40 = 10 pupils.
Step 3. Oranges and grapes share these 10 pupils equally, so 10 ÷ 2 = 5 pupils chose grapes.
Check: Apples 20, bananas 10, oranges 5 and grapes 5. 20 + 10 + 5 + 5 = 40.
Common Mistakes
- Counting symbols instead of objects. When each symbol stands for 4, six symbols show 24, not 6. Fix: read the key first and say it aloud.
- Assuming each grid line is 1. On a bar graph scaled in tens, a bar reaching the fourth line shows 40. Fix: find the gap between two labelled lines before reading any bar.
- Guessing between grid lines. A bar halfway between 100 and 150 shows 125, not 105 or 110. Fix: find half the gap and add it to the lower value.
- Reading a line graph from the wrong axis. Children sometimes report the time instead of the quantity. Fix: put a finger on the point, then move straight across to the vertical scale.
- Comparing pie charts with different totals. A larger slice in one chart does not always mean more people than a smaller slice in another chart. Fix: ask what whole each chart represents.
- Not checking a completed table. A missing value can be found correctly and still be copied wrongly. Fix: check that the parts add up to the total.
Teaching Graphs and Charts Outside Singapore
Graph reading transfers well between curricula, but a few points are worth knowing.
- Names for the same chart. The primary syllabus says “picture graph”, and the Secondary 1 syllabus says “pictogram”. Some materials elsewhere say “pictograph”. Some US materials call a pie chart a circle graph.
- Timing. In Singapore’s current syllabus, graphs and charts run from Primary 1 to Primary 4. Your local curriculum may place them differently, so decide by readiness rather than age. The Singapore Math Grade Levels guide explains why direct conversions are unreliable.
- Prerequisites. Scales depend on skip counting and multiplication tables. Pie charts depend on fractions of a whole and fraction of a set, which is also a Primary 4 topic. Check these first.
- Reading before drawing. The Primary 1 to 4 content is about reading and interpreting, plus completing a table at Primary 4. Practise questions that ask what a graph shows, not only how to draw one.
- Units and money. Singapore uses metric units and Singapore dollars and cents, so graph questions in Singapore materials use them too.
How to Practise Graphs and Charts at Home
Short, regular practice works better than one long session.
- Collect real data together: the colours of passing cars, or the fruit eaten in a week.
- Make a picture graph where one symbol stands for one item, then redraw it with one symbol for 2 items.
- Turn the same data into a bar graph with a labelled scale.
- Ask three questions about it: which is most, which is least, and how many more.
- Read a weather table or chart and talk about when the temperature rose the most.
- Once a week, cut a paper circle into halves and quarters and use it as a pie chart for a group of 8, 12 or 20 objects.
Ten minutes of talking about a real graph is often worth more than a page of drawing.
Try These
- In a picture graph, each symbol stands for 10 cars. A row has 6 symbols. How many cars does the row show?
- A bar graph has a scale marked 0, 50, 100, 150 and 200. A bar ends halfway between 100 and 150. What value does it show?
- A class has 36 pupils. 15 walk to school and 12 take a bus. The rest come by car. What number goes in the table for car?
- A pie chart shows the favourite sports of 48 pupils. A quarter chose swimming. How many pupils chose swimming?
Answers
- 60 cars, because 6 × 10 = 60.
- 125. The gap between 100 and 150 is 50, and half of 50 is 25.
- 9 pupils, because 36 − 15 − 12 = 9.
- 12 pupils, because 1/4 of 48 = 48 ÷ 4 = 12.
What Comes Next
Graph reading returns at every later stage.
- In Primary 6 Standard Mathematics, the Statistics content is Average.
- In Foundation Mathematics, tables, bar graphs and line graphs return at Primary 5, and pie charts at Primary 6. See Standard and Foundation Mathematics.
- In Secondary 1, Statistical Diagrams covers these displays again, including why a diagram can mislead.
- In Secondary 2, Mean, Median and Mode adds measures of central tendency.
Careful reading of scales at Primary 3 pays off in every later data topic.
Frequently Asked Questions
When do Singapore students learn graphs and charts?
From Primary 1 to Primary 4: picture graphs at P1 and P2, bar graphs at P3, and tables, line graphs and pie charts at P4.
Is there statistics in Primary 5?
Not in Standard Mathematics. Primary 5 Standard has no Statistics topic, and average is a Primary 6 topic.
Do Primary 4 students draw pie charts?
The Primary 4 content lists reading and interpreting pie charts, and completing a table from data. Drawing pie charts is not part of that list.
What does “different scales on the axes” mean?
At Primary 3, a bar graph’s axis may count in steps other than 1. Students must work out the size of each step before reading a bar.
Is a picture graph the same as a pictogram?
Yes, they are the same kind of chart. The primary syllabus says “picture graph” and the Secondary 1 syllabus says “pictogram”.
Are line graphs and pie charts in Foundation Mathematics?
Yes. Foundation Mathematics includes tables, bar graphs and line graphs at Primary 5, and pie charts and average at Primary 6.
Helpful Reading
- Singapore Mathematics | International Edition: Average
- Singapore Mathematics | International Edition: Statistical Diagrams
- Singapore Mathematics | International Edition: Multiplication Tables
- Statistics and Data | Mathematics Knowledge Object
- Why Children Misread Mathematics Diagrams
- How Primary Mathematics Foundations Are Built
- How to Make Sense of the PSLE Mathematics Syllabus
- MOE Primary Mathematics Syllabus
Graphs and Charts in Singapore Mathematics
Read the key first.
Then the scale.
Then the numbers.
Ask what each mark stands for, and what the whole is.
Taught in this order, graphs become a way of asking questions about numbers.
That habit carries a child from picture graphs at Primary 1 into the statistics of secondary school.
Ask Bukit Timah Tutor
Bukit Timah Tutor teaches Mathematics in small groups of three students in Singapore.
If your child is learning Singapore Mathematics at home, in an international school or in a Singapore school, and you are unsure where to begin with this topic, send us a short message with the student’s level and one example of the work.
Bukit Timah Tutor
8 Fourth Avenue, Singapore 268674
Near Sixth Avenue MRT
Three-student Mathematics tutorials
By appointment
Properly taught kids shine a bright light into the future.
Singapore Mathematics | International Edition is a Bukit Timah Tutor guide series for families and teachers outside Singapore. It is not a textbook and is not affiliated with MOE, SEAB or any publisher. Syllabus details were checked against MOE and SEAB documents in October 2026. Always confirm current requirements with your school.
← Previous: Singapore Mathematics | International Edition: Nets
Next: Singapore Mathematics | International Edition: Standard and Foundation Mathematics →
All 100 topics in the International Edition