
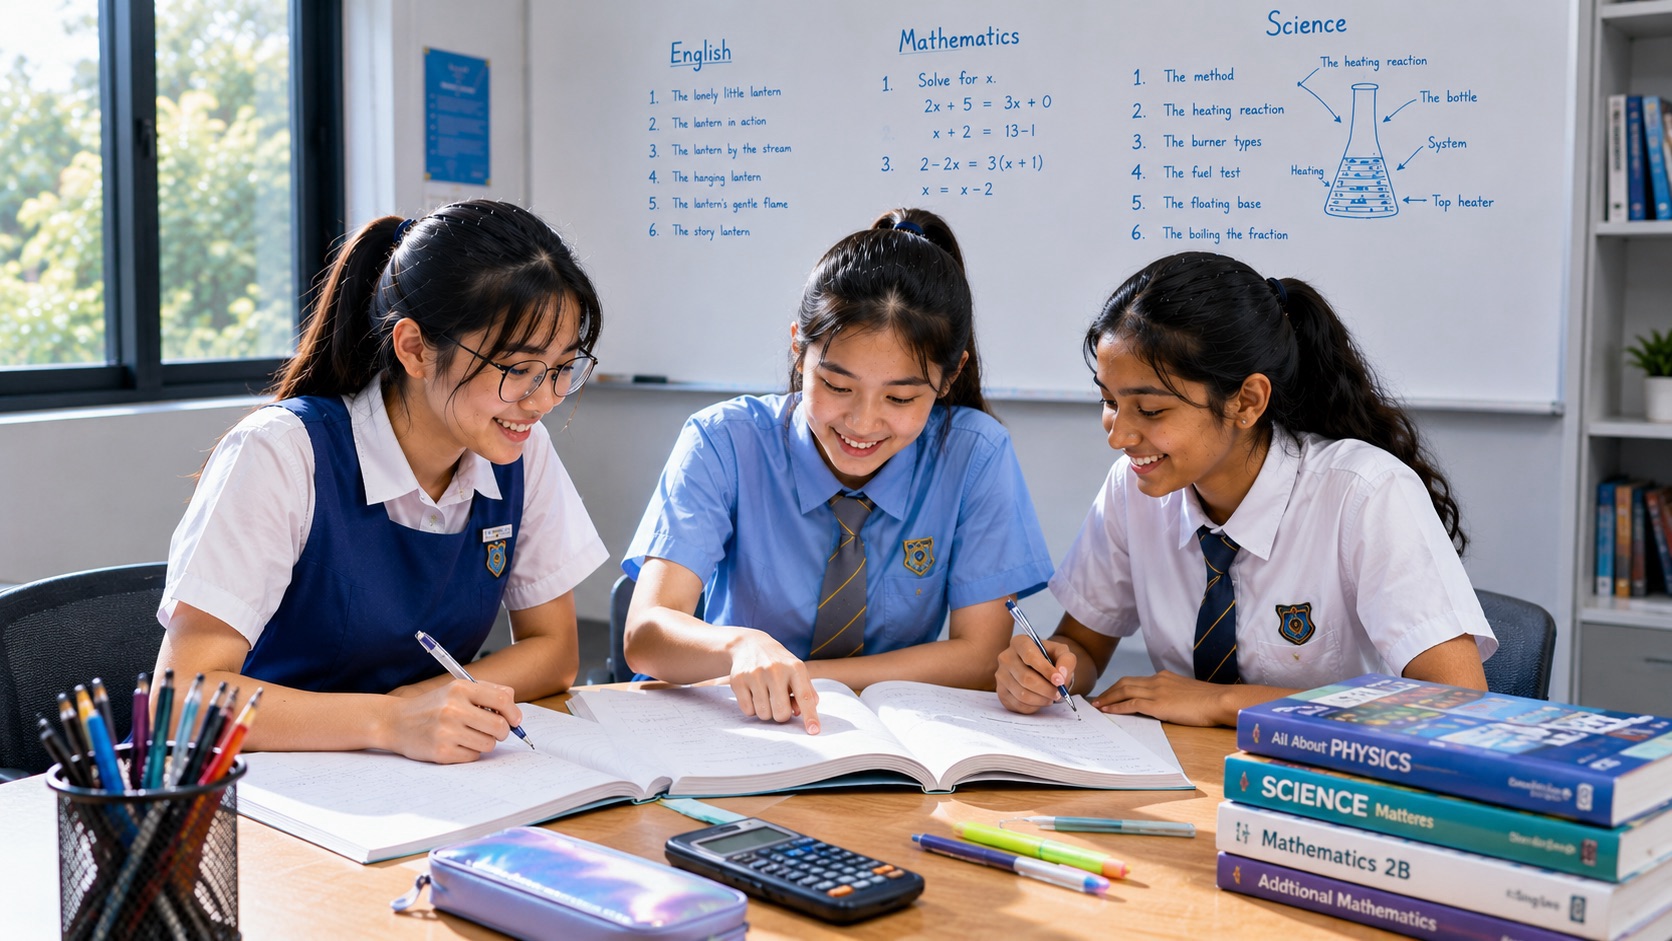
Singapore’s 2027 SEC Mathematics syllabuses are organised around three content strands: Number and Algebra, Geometry and Measurement, and Statistics and Probability. That structure is shared by G1 Mathematics K110, G2 Mathematics K210 and G3 Mathematics K310.
At first glance, these can look like three large folders for sorting chapters. That interpretation is too weak. The strands are better understood as three mathematical languages for describing the world. Number and Algebra expresses quantity and relationship. Geometry and Measurement expresses space, shape and magnitude. Statistics and Probability expresses data, variation and uncertainty. The real power of Secondary Mathematics appears when the learner can move between them.
This matters because the SEC examination is not designed as three sealed subjects tested independently. The official G1, G2 and G3 syllabuses also emphasise mathematical processes such as reasoning, communication, application and problem-solving. In real-world questions, ideas from different strands can interact. A journey can involve rate, graph interpretation and measurement. A floor plan can involve scale, algebra, geometry and cost. A data question can require percentage, probability and contextual judgement.
This guide explains what each strand does, how the strands develop from G1 through G3, why they depend on one another, how they commonly fail, and how students should learn them as one connected mathematical system.
For the full SEC architecture, start with How Secondary Mathematics Syllabus Works | Singapore SEC G1, G2 & G3 (2027). For assessment structure, continue to How AO1, AO2 & AO3 Work in SEC Secondary Mathematics and How Paper 1 and Paper 2 Work in SEC Secondary Mathematics.
One-sentence answer
The three SEC Mathematics strands work as a connected system: Number and Algebra models quantities and relationships, Geometry and Measurement models space and magnitude, and Statistics and Probability models data and uncertainty; stronger Mathematics comes from being able to move fluently within and between all three.
The official common spine across G1, G2 and G3
The 2027 SEAB syllabuses for G1 K110, G2 K210 and G3 K310 all use the same three-strand structure:
- Number and Algebra
- Geometry and Measurement
- Statistics and Probability
That shared architecture is important. G1, G2 and G3 are not three unrelated versions of school Mathematics. They are differently loaded routes through the same broad mathematical territory.
As students move from G1 to G2 to G3, the differences appear in breadth, abstraction, algebraic load, connectedness, assessment weightings and the amount of independent problem-solving expected. But the underlying mathematical world remains recognisable.
Why three strands instead of one long chapter list?
A chapter list is useful for teaching order. A strand structure reveals deeper relationships.
For example, percentage, equations and graphs may appear in different textbook chapters, but all belong to the larger problem of describing quantitative relationships. Pythagoras, similarity and trigonometry may appear separately, but all describe structure in space. Mean, probability and cumulative frequency may sit in different chapters, but all help us reason about data and uncertainty.
The strand is therefore a conceptual family. It tells us what kind of mathematical work is happening beneath the surface.
Strand 1: Number and Algebra
Number and Algebra is the quantitative engine of Secondary Mathematics.
Number deals with quantity, magnitude, operations, ratio, percentage, rate, numerical representation and relationships between values. Algebra extends that world by allowing quantities to be represented generally. Instead of solving one numerical case, algebra describes a whole family of possible cases.
This is why algebra becomes increasingly central after Primary school. It is not simply a new topic involving letters. It is a compression system for relationships.
Consider the difference between these two statements:
3 notebooks cost $12.
and
C = 4n.
The first describes one case. The second describes a relationship that can generate many cases. That ability to generalise is what makes algebra portable.
What Number and Algebra is really teaching
Behind the individual topics, the strand develops several large capabilities:
- understanding quantity and magnitude;
- recognising multiplicative relationships;
- using ratio, rate and percentage;
- representing unknown or variable quantities;
- building and manipulating expressions;
- forming and solving equations;
- representing relationships with functions and graphs;
- using symbolic structure to generalise.
At higher levels, the student’s job shifts from following procedures to seeing structure. A quadratic is not just an equation-solving chapter. It is a particular relationship with algebraic, graphical and geometrical behaviour. A formula is not merely something to substitute into. It is a statement about how quantities depend on one another.
Why Number and Algebra becomes infrastructure for the other strands
Weakness in Number and Algebra often appears later as weakness somewhere else.
- Geometry requires algebra when lengths or angles are unknown.
- Trigonometry requires ratio and algebra.
- Coordinate geometry requires equations and graphs.
- Statistics frequently requires percentage, ratio and numerical comparison.
- Probability requires fractions, ratios and algebraic organisation.
- Real-world modelling often starts by turning quantities into algebraic relationships.
This is why a Secondary 3 student can appear to have a trigonometry problem when the real failure is algebraic rearrangement. The current topic is where the weakness becomes visible, not necessarily where it began.
G1 Number and Algebra: dependable quantitative use
G1 Mathematics places strong emphasis on fundamental mathematical knowledge and practical application. In Number and Algebra, the central aim is to make numerical and symbolic relationships usable.
Students need dependable control of operations, fractions and decimals, ratio, proportion, percentage, rate, speed, algebraic expressions, formulae, equations and graphical relationships at the level required by the syllabus.
The instructional emphasis should remain concrete enough that algebra is connected to meaning. A letter should represent a quantity, not merely a symbol to be moved. Percentage should remain attached to a base quantity. Rate should remain a comparison between quantities rather than a formula fragment.
G2 Number and Algebra: structural control
G2 broadens the algebraic and graphical load. Students increasingly need to manipulate expressions, interpret functions, solve relationships and move between symbolic and graphical forms.
The important transition is from using algebra to thinking algebraically. The student should begin recognising equivalent forms, seeing what transformations preserve a relationship, and choosing algebraic representations because they simplify a problem.
G3 Number and Algebra: algebra as a general-purpose language
In G3, Number and Algebra becomes a major operating language for the whole course. The route includes a broader range of functions, equations, graphical relationships and symbolic structures.
At this level, algebraic fluency matters not because every question is an algebra question, but because algebra is often the tool that allows other Mathematics to proceed.
A student who requires intense attention for every sign, bracket and rearrangement has less attention available for AO2 problem-solving. This is one reason stronger G3 performance depends on highly reliable fundamentals.
Common Number and Algebra failure: additive thinking inside multiplicative problems
One of the oldest mathematical errors survives well into Secondary school: treating a multiplicative relationship as additive.
Ratio, percentage, scale, rate and similarity all depend heavily on multiplicative thinking. If a student interprets “twice as much” with the same mental habits used for “two more”, later work becomes unstable.
The repair is not more formula memorisation. It is rebuilding the relationship between quantities.
Common Number and Algebra failure: symbol pushing without equality sense
Students sometimes learn equations as a set of instructions: “move this across, change the sign”. That can produce correct answers in familiar cases while hiding the actual invariant.
An equation states that two expressions have equal value. Valid transformations preserve that equality.
Once equality is understood structurally, algebra becomes easier to transfer to formulae, simultaneous relationships, coordinate work and modelling.
Common Number and Algebra failure: graph as picture instead of relationship
A graph is not merely a shape drawn on axes. It is a representation of how quantities vary together.
Students should be able to connect:
equation ↔ table ↔ graph ↔ verbal relationship
If those representations remain separate, later functions and real-world graph interpretation become unnecessarily difficult.
Strand 2: Geometry and Measurement
Geometry and Measurement is the spatial engine of Secondary Mathematics.
Geometry asks about structure in space: shape, position, angle, congruence, similarity and relationships between objects. Measurement connects that structure to magnitude: length, area, volume, angle and other measurable quantities.
The strand therefore asks two different but connected questions:
- What must be true because of the shape or configuration?
- How large is the relevant quantity?
Strong geometry moves between both.
What Geometry and Measurement is really teaching
- reading spatial relationships;
- reasoning from properties and constraints;
- working with angle relationships;
- recognising congruence and similarity;
- using scale;
- calculating length, area and volume;
- using Pythagoras and trigonometric relationships where appropriate;
- connecting diagrams to algebra and coordinate representations;
- checking whether a spatial result is geometrically plausible.
The deeper skill is not formula recall. It is learning to see which relationships are forced by the geometry.
A diagram is evidence, not truth by appearance
One of the most important geometry habits is distinguishing what is given from what merely looks true.
A line may look perpendicular but not be stated or marked as perpendicular. Two sides may look equal but not be given equal. A sketch may not be drawn to scale.
Students should learn to ask:
- What is explicitly stated?
- What is marked on the diagram?
- What follows logically from known geometric properties?
- What am I only assuming because of appearance?
This habit is AO3 reasoning in spatial form.
G1 Geometry and Measurement: make space usable
G1 emphasises practical geometry and measurement. Students need to interpret angles, shapes, scale, dimensions and measurement relationships in meaningful contexts.
The learner should become comfortable converting a physical situation into a labelled diagram, selecting a relevant relationship and reporting the result with appropriate units and practical interpretation.
G2 Geometry and Measurement: relationships become more connected
G2 expands the range and integration of geometric work. Similarity, Pythagoras, trigonometric reasoning, mensuration and other geometric relationships require stronger coordination between diagram reading and algebraic execution.
The student’s job increasingly becomes: identify the structure, choose the relationship, then calculate.
G3 Geometry and Measurement: geometry becomes a reasoning network
G3 carries a broader spatial system, including richer trigonometric, coordinate and vector relationships within the overall course.
At this level, geometry often becomes inseparable from algebra. A diagram can produce equations. Coordinates can express geometric relationships numerically. Vectors can encode direction and displacement algebraically. Trigonometry can turn spatial constraints into equations.
This is one of the clearest examples of strands connecting rather than operating separately.
Common Geometry failure: formula before diagram
Students sometimes search memory for formulas before understanding the spatial structure.
A stronger sequence is:
read → label diagram → identify relationship → choose formula → calculate
The formula should be selected because the geometry makes it valid.
Common Geometry failure: losing units across dimensions
Length, area and volume live in different dimensions.
A length may be measured in cm, an area in cm² and a volume in cm³. Students who treat units as labels rather than structural information can produce numerically correct-looking but dimensionally impossible answers.
Unit checking should therefore be part of geometry working, not a final cosmetic step.
Common Geometry failure: trigonometry without triangle sense
Trigonometry can become a button sequence if students learn it only as SOH-CAH-TOA or a list of formulas.
The student should first identify the geometric configuration, the known and unknown quantities, and the angle relationships. Only then should the trigonometric ratio be selected.
This preserves meaning and makes error checking possible.
Strand 3: Statistics and Probability
Statistics and Probability is the uncertainty engine of Secondary Mathematics.
Statistics asks how data can be collected, represented, summarised, compared and interpreted. Probability asks how uncertainty can be described mathematically.
Together, the strand addresses a central problem of real decision-making: what can we reasonably conclude when information is variable or uncertain?
What Statistics and Probability is really teaching
- reading tables, charts and graphs;
- summarising data;
- comparing distributions;
- understanding centre and spread;
- reasoning with proportions and frequencies;
- representing uncertain outcomes;
- calculating probability;
- interpreting results in context;
- distinguishing what data supports from what it does not.
The deepest shift is from calculation to judgement. A statistic is not useful because it can be calculated. It is useful because it helps answer a question about data.
G1 Statistics and Probability: data for practical decisions
G1 develops practical data and probability literacy. Students should be able to read representations, calculate relevant summaries or probabilities, and interpret what those values mean in everyday situations.
The learning goal should remain connected to decisions: What does the graph say? Which option is more common? How likely is the event? Does the numerical result support the claim?
G2 Statistics and Probability: comparison and interpretation deepen
G2 carries a broader statistical and probability toolkit. Students increasingly need to compare distributions, interpret data displays and manage more structured probability situations.
This is also reflected in the examination architecture: G2 Paper 2 Section B offers a choice between a Geometry and Measurement question and a Statistics and Probability question based on the specified underlined content.
That makes data interpretation a substantial independent route rather than a small end-of-course topic.
G3 Statistics and Probability: uncertainty becomes a reasoning discipline
G3 broadens the statistical and probability machinery further. Students work with richer representations and measures and must make increasingly careful comparisons and interpretations.
The challenge is rarely only computational. Two data sets can have similar centres and different spreads. A graph can suggest a pattern without proving a causal relationship. A probability can be calculated correctly yet interpreted badly.
This strand therefore becomes an ideal home for AO3: explain what the evidence supports and what it does not.
Common Statistics failure: average as one universal idea
Students often use “average” as if it names one object. Different measures of centre answer different questions and can react differently to extreme values or distribution shape.
The learner should not only know how to calculate a measure. They should know why that measure is informative in the situation.
Common Statistics failure: reading a graph without reading the axes
A visually dramatic graph can create a strong impression, but the mathematical meaning lives in the scales, intervals, labels and quantities represented.
Before interpreting any graph, students should check:
- What does each axis represent?
- What are the units?
- What is the scale?
- Does the axis begin at zero?
- Are intervals equal?
- What quantity is actually being compared?
Common Probability failure: treating probability as intuition
Human intuition about chance is unreliable. Probability replaces intuition with a structured model of possible outcomes and their relationships.
The student should identify the event structure before calculating. Are outcomes equally likely? Are events independent? Is an “and” relationship or an “or” relationship being modelled? Is conditional information present?
The calculation should emerge from the event structure.
The strands meet in real-world Mathematics
Real-world contexts are where the three strands stop looking separate.
Consider a transport problem:
- Number and Algebra handles rates, cost and equations.
- Geometry and Measurement handles distance, scale or spatial constraints.
- Statistics and Probability may handle travel-time data or uncertainty.
Or consider a building plan:
- Geometry determines dimensions and area.
- Number and Algebra determines cost or proportional scale.
- Statistics may be used to compare estimates or data from several options.
The situation chooses the combination. The textbook does not.
Number and Algebra ↔ Geometry and Measurement
This is one of the strongest cross-strand bridges.
Geometry creates relationships. Algebra lets the student express and solve them.
Examples include:
- unknown angles represented with variables;
- similarity expressed through ratios;
- coordinate geometry expressed through equations;
- trigonometric relationships rearranged algebraically;
- area or volume constraints converted into equations.
A student who sees these as separate chapters carries more cognitive load than a student who sees the common structure.
Number and Algebra ↔ Statistics and Probability
Statistics and Probability depends heavily on number relationships.
- Percentages express relative frequency.
- Ratios express comparison.
- Algebra can represent unknown frequencies or probabilities.
- Graphs represent quantitative relationships.
- Rates and proportions support interpretation of data.
Weak number sense can therefore make statistical conclusions fragile even when formulas are remembered.
Geometry and Measurement ↔ Statistics and Probability
This connection is less obvious but still important.
Data is often represented spatially: bars, histograms, cumulative frequency curves, scatter plots and other diagrams use position and scale to encode quantity. Probability can involve geometric regions or spatial arrangements. Real-world data collection often depends on measurement.
The ability to read space accurately therefore supports data interpretation.
The fourth layer: mathematical processes run through every strand
The official syllabuses do not stop at content. Reasoning, communication, application and problem-solving are also emphasised and assessed.
This means every strand has at least three levels of mastery:
- Operate: perform standard techniques.
- Apply: recognise when and how to use them.
- Reason: explain why the relationship and conclusion are valid.
These correspond closely to AO1, AO2 and AO3.
AO1 inside the three strands
| Strand | Typical AO1 work |
|---|---|
| Number and Algebra | calculate, simplify, substitute, solve, read a standard graph |
| Geometry and Measurement | apply standard properties and formulae, calculate lengths, areas, volumes or angles |
| Statistics and Probability | read data displays, calculate summaries, calculate probabilities |
AO1 asks whether the machinery is installed and reliable.
AO2 inside the three strands
| Strand | Typical AO2 work |
|---|---|
| Number and Algebra | form equations, select a representation, connect graphs and formulas, model rates |
| Geometry and Measurement | identify which spatial relationship applies, connect diagram and algebra, select a trigonometric or similarity route |
| Statistics and Probability | choose useful summaries, interpret data, model uncertain events, compare distributions |
AO2 asks whether the student can navigate inside the strand and between strands.
AO3 inside the three strands
| Strand | Typical AO3 work |
|---|---|
| Number and Algebra | justify a relationship, explain why a solution is impossible or why a pattern holds |
| Geometry and Measurement | give geometric reasons, justify a spatial conclusion, explain why a method applies |
| Statistics and Probability | defend a comparison, explain what data supports, justify a probability conclusion |
AO3 asks whether the student’s Mathematics can be inspected and trusted.
Why students should not revise by strand alone
Strand-based revision is useful for locating weak families of knowledge. But final examination preparation must also cross strand boundaries.
If a student revises three weeks of Number and Algebra, then two weeks of Geometry, then two weeks of Statistics, the student may become strong inside each block but weak at switching.
The examination asks the student to repeatedly identify which mathematical world has appeared and sometimes combine worlds inside one problem.
A better progression is:
build within strand → connect within strand → mix across strands → integrate in real-world problems → commission under full-paper conditions
The strand diagnostic
When a student is struggling, begin with four questions.
- Which strand contains the visible problem?
- Which earlier concept inside that strand is required?
- Does the problem depend on another strand?
- Is the failure actually conceptual, procedural, representational or transfer-based?
This prevents a common error: treating the current worksheet heading as the complete diagnosis.
Example diagnostic: a trigonometry problem
Visible strand: Geometry and Measurement.
Possible hidden dependencies:
- ratio understanding from Number and Algebra;
- algebraic rearrangement from Number and Algebra;
- angle-mode calculator state;
- diagram interpretation;
- unit conversion.
A student can therefore fail “trigonometry” without the trigonometric concept being the main problem.
Example diagnostic: a data comparison problem
Visible strand: Statistics and Probability.
Possible hidden dependencies:
- percentage or ratio from Number and Algebra;
- graph-reading scale;
- understanding of centre versus spread;
- AO3 communication;
- context interpretation.
Again, the final chapter label may not identify the earliest repair point.
Example diagnostic: a graph problem
A graph can belong to several mathematical worlds at once.
- A function graph belongs strongly to Number and Algebra.
- A coordinate-geometry graph connects Number and Algebra with Geometry.
- A data graph belongs to Statistics.
- A distance-time graph can become a real-world model involving rates.
The representation is the same broad object—axes and plotted information—but the mathematical meaning changes.
Secondary 1: establish the three languages
Secondary 1 should be treated as the year in which the learner becomes comfortable entering all three mathematical languages.
- Number and Algebra formalises quantity and introduces stronger symbolic language.
- Geometry and Measurement formalises spatial relationships and measurement reasoning.
- Statistics and Probability formalises data representation and uncertainty.
The most important learning goal is not maximum speed. It is reliable translation between meaning and representation.
Secondary 2: strengthen the bridges
By Secondary 2, the strands begin to interact more strongly.
Algebra supports more graph and geometry work. Proportional reasoning supports similarity and scale. Data interpretation becomes richer. Students should increasingly be asked to compare representations and choose routes rather than only follow them.
Secondary 2 is therefore an important bridge-repair year before upper-secondary integration increases the load.
Secondary 3: integration becomes unavoidable
Upper-secondary Mathematics makes strand boundaries more porous.
Students encounter problems where algebra, graphs, geometry, trigonometry, statistics and probability can interact. The number of plausible routes increases. This raises AO2 demands.
The student’s job shifts from “do the chapter” to “recognise the mathematical object”.
Secondary 4: the strands must behave like one system
By the final year, the three strands should no longer exist only as revision folders.
Full-paper work repeatedly moves between them. Real-world questions can combine them. Examination timing removes the luxury of extended re-orientation.
Secondary 4 preparation should therefore focus on switching, integration and recovery.
A three-strand weekly study system
A student does not need to study every strand equally every day. But all three should remain alive across a reasonable revision cycle.
One possible weekly structure is:
- Session 1: targeted Number and Algebra repair;
- Session 2: Geometry and Measurement problem set;
- Session 3: Statistics and Probability interpretation;
- Session 4: mixed cross-strand questions;
- Session 5: corrections, retrieval and one real-world integrated problem.
The exact balance should follow diagnostic need rather than a fixed calendar.
A three-strand error log
Error logs become more useful when they track both strand and failure type.
| Error | Strand | Failure type | Repair |
|---|---|---|---|
| Wrong percentage base | Number & Algebra | concept/representation | rebuild base quantity distinction |
| Wrong trigonometric ratio | Geometry & Measurement | selection | label triangle before formula |
| Mean used to justify spread | Statistics & Probability | interpretation | compare centre and spread separately |
| Graph relation misread | cross-strand | representation | translate graph ↔ equation ↔ words |
This creates a much clearer repair map than writing only “careless”.
How tutors should teach across strands
Strong tuition should preserve each strand’s internal logic while deliberately exposing the bridges.
- When teaching algebra, show where it will later operate in geometry and statistics.
- When teaching geometry, ask students to express spatial relationships symbolically.
- When teaching statistics, connect numerical summaries to graphical representation and contextual decisions.
- When teaching real-world problems, ask which strands are contributing.
This helps students build one Mathematics rather than dozens of isolated chapters.
Why one weak strand can distort the others
Because the strands share dependencies, weakness propagates.
Weak Number and Algebra can make geometry and probability difficult. Weak Geometry can damage real-world modelling involving scale, navigation or measurement. Weak Statistics can prevent the student from interpreting data even when the arithmetic is correct.
The best repair is often the earliest high-leverage concept that explains several visible errors at once.
Why strength in one strand can support another
Connections also work positively.
- Strong algebra makes coordinate geometry cleaner.
- Strong visual reasoning makes graph interpretation easier.
- Strong ratio sense supports probability and similarity.
- Strong data interpretation improves real-world decision problems.
Teaching should exploit these supports instead of treating them as accidental.
What a balanced student profile looks like
A balanced SEC Mathematics student does not need identical strength in every topic. But the student should have enough capability in every strand that one does not become a permanent bottleneck.
A useful profile asks:
- Can I represent quantitative relationships algebraically?
- Can I reason accurately from diagrams and measurements?
- Can I interpret data and uncertainty?
- Can I move between these worlds when a problem requires it?
The fourth question is the most important at examination level.
The strands and Paper 1/Paper 2
The paper structure changes by G level, but the broader lesson is stable: examination papers repeatedly sample and combine the content system.
G1 makes strand distribution particularly visible: Paper 1 combines Number and Algebra with Geometry and Measurement, while Paper 2 combines Number and Algebra with Statistics and Probability. This makes Number and Algebra the shared infrastructure across both papers.
G2 and G3 require broader whole-course switching. Their Paper 2 real-world problems further emphasise that strands can interact inside extended contexts.
The strands and calculator use
Calculator support appears across all three strands, but its role changes.
| Strand | Calculator role | Human judgement still required |
|---|---|---|
| Number & Algebra | evaluate expressions, support numerical work | model, manipulate, choose relationship, check magnitude |
| Geometry & Measurement | evaluate trigonometric and measurement calculations | read diagram, select relationship, manage units and mode |
| Statistics & Probability | support numerical summaries and calculations | choose measure, model event structure, interpret result |
The calculator reduces computational load. It does not decide which strand’s reasoning is needed.
The strands and real-world problem solving
Real-world problem-solving works best when students stop asking “which chapter?” and start asking “which mathematical relationships?”
A useful annotation is:
- N/A: quantity, rate, percentage, equation, function?
- G/M: shape, angle, distance, area, scale?
- S/P: data, frequency, variation, chance?
Many extended problems will activate more than one label.
A three-strand problem-solving routine
- Locate the quantities. What is changing or unknown?
- Locate the space. Is geometry, scale or measurement relevant?
- Locate the uncertainty. Is data or probability relevant?
- Choose the smallest sufficient model.
- Execute and reconnect the result to the context.
This is not a compulsory exam script. It is a training scaffold for seeing the three mathematical worlds.
What parents should understand about “weak in Maths”
“Weak in Mathematics” is too broad to guide repair.
A child may have:
- strong Number and Algebra but weak Geometry;
- good procedures but weak Statistics interpretation;
- good isolated strand knowledge but poor cross-strand transfer;
- one small algebraic weakness contaminating several strands;
- good understanding but weak examination retrieval.
Diagnosis should identify the structure of the weakness before more practice is prescribed.
What students should ask after every wrong answer
- Which strand was visible?
- Which concept inside that strand was needed?
- Did another strand contribute?
- Did I fail to know the Mathematics, recognise it, execute it or explain it?
- What is the smallest repair that would prevent this error next time?
This turns corrections into system maintenance.
The deepest point: the strands are different views of relationships
Number and Algebra, Geometry and Measurement, and Statistics and Probability can look different because they use different representations. But all three are ultimately concerned with relationships.
- Algebra asks how quantities depend on one another.
- Geometry asks how spatial properties constrain one another.
- Statistics asks how values vary within a group.
- Probability asks how possible outcomes relate to one another.
Mathematics becomes coherent when the learner sees that common grammar.
The deepest point: the strongest students do not carry more chapters—they carry a better network
A novice often stores Mathematics as a list:
percentages, algebra, graphs, triangles, trigonometry, averages, probability…
An expert stores a network:
quantity → relationship → representation → transformation → constraint → uncertainty → interpretation
The syllabus strands are the first large map of that network.
Structured summary
SEC_MATHEMATICS_THREE_STRANDS_2027

ROUTES = {
  G1: K110,
  G2: K210,
  G3: K310
}

STRANDS = {
  Number_and_Algebra: {
    domain: "quantity + relationship + symbolic generalisation",
    core_jobs: [
      calculate,
      compare,
      represent,
      formulate,
      solve,
      graph,
      generalise
    ]
  },

  Geometry_and_Measurement: {
    domain: "space + shape + magnitude + constraint",
    core_jobs: [
      visualise,
      measure,
      infer,
      scale,
      calculate,
      justify_spatial_relationship
    ]
  },

  Statistics_and_Probability: {
    domain: "data + variation + uncertainty",
    core_jobs: [
      represent_data,
      summarise,
      compare,
      model_chance,
      interpret,
      justify_conclusion
    ]
  }
}

CROSS_STRAND_BRIDGES = [
  algebra_to_geometry,
  ratio_to_similarity,
  algebra_to_coordinate_geometry,
  percentage_to_statistics,
  number_to_probability,
  measurement_to_data,
  graphs_across_functions_and_statistics
]

YEAR_RUNTIME = {
  Sec1: "establish the three mathematical languages",
  Sec2: "strengthen bridges",
  Sec3: "increase integration",
  Sec4: "commission as one system"
}

LEARNING_SEQUENCE =
within_strand_foundations
→ within_strand_connections
→ cross_strand_switching
→ real_world_integration
→ examination_commissioning

DIAGNOSIS =
visible_strand
→ earliest_dependency
→ cross_strand_dependency
→ failure_type
→ repair
→ retest

END_STATE =
"The learner no longer sees three folders of chapters, but one connected mathematical system for quantity, space, data and uncertainty."
Official 2027 references
- SEAB — K110 G1 Mathematics SEC Syllabus 2027
- SEAB — K210 G2 Mathematics SEC Syllabus 2027
- SEAB — K310 G3 Mathematics SEC Syllabus 2027
- SEAB — SEC syllabus directory for school candidates
Checked against the current 2027 SEC Mathematics syllabuses available from SEAB in September 2026.
Continue through the Secondary Mathematics syllabus series
- How Secondary Mathematics Syllabus Works | Singapore SEC G1, G2 & G3 (2027)
- How AO1, AO2 & AO3 Work in SEC Secondary Mathematics | G1, G2 & G3
- How Paper 1 and Paper 2 Work in SEC Secondary Mathematics | G1, G2 & G3 (2027)
- How Real-World Problem Solving Works in SEC Secondary Mathematics | G1, G2 & G3 (2027)
- How Calculator, Formula Sheet & Essential Working Work in SEC Secondary Mathematics | G1, G2 & G3 (2027)
- How SEC Mathematics Works | Singapore G1, G2 & G3 Mathematics Explained
- Singapore Mathematics Hub
Number tells us how much. Algebra tells us how quantities relate. Geometry tells us how space is constrained. Measurement tells us how large. Statistics tells us what the data is doing. Probability tells us how uncertain we are. Secondary Mathematics becomes powerful when the learner can make all six ideas cooperate.